Vision
Agricultural land is managed to optimise productive capacity, while avoiding or minimising environmental impacts.
Scope
All parts of the landscape that have been developed for the purpose of dryland and irrigated agricultural production (including the soil and water resources they rely and impact on).
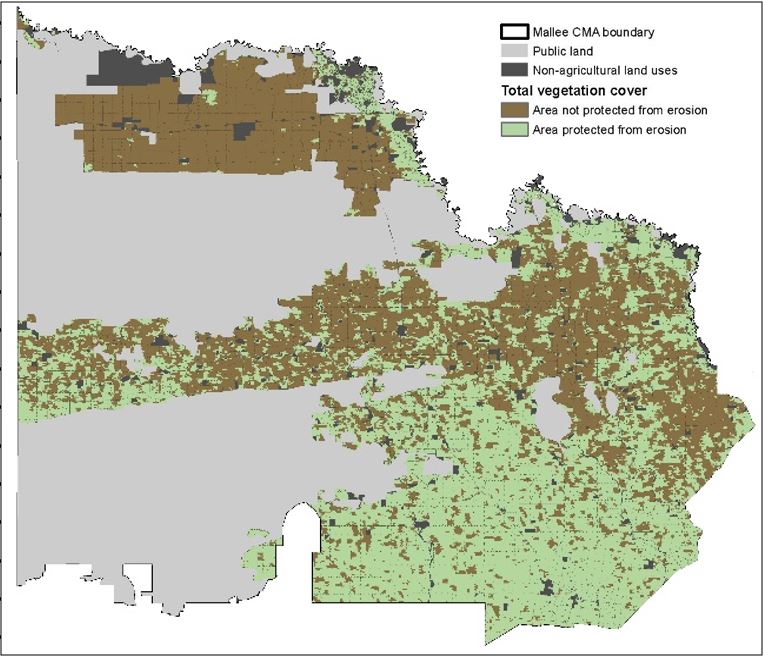
Some 62 percent of our region is under agricultural production, with an estimated 2.4 million hectares of dryland farming and a further 88,140 hectares of irrigation development (Figure 23). Natural and built up/ urban environments represent the other primary land uses across the region’s 3.99 million hectares.
Dryland agriculture occurs in the northern, central and southern parts of the region and includes the cropping of a wide variety of cereals and pulse crops such as wheat, barley, vetch, chickpeas, lentils and canola. Livestock also forms a part of many farm operations and primarily includes sheep for their wool products and lambs for their quality meat. Cattle and goats are also present in smaller numbers.
These agricultural industries have largely been established where they can be supported by our regional soils. The large blocks of remnant vegetation which remain in the landscape (such as in our parks and reserves) are often represented by their sandy infertile soils, which are unsuitable for agriculture.
Irrigation development reliant on surface water extends adjacent to the Murray River from Nyah to the South Australian border, encompassing private diverters and the pumped irrigation districts of Mildura, Merbein, Red Cliffs, Robinvale and Nyah. The primary crops produced in these areas include almonds, table and wine grapes, and citrus.
A 191,600 hectare groundwater irrigation district also exists centred on the town of Murrayville, with groundwater from the Murray Group Limestone Aquifer the sole source of water for town, stock and domestic, and irrigation supply in the area. Irrigated production encompasses field crops, potatoes and olives.
This section provides an overview on the current condition of agricultural land in the Mallee. State-wide and regional indicators have been applied to establish a baseline, and where available identify long term trends, from which progress against our medium-term (6-year) and long-term outcome targets for agricultural land can be determined.
Productivity
The Mallee is recognised nationally and internationally for its agricultural produce. It is a key part of Victoria’s food bowl, producing significant amounts of the state’s grain, fruit and nut crops.
Value
Agriculture plays a major role in sustaining the economy of the region, with the gross value of production in 2019–20 being some $2.43 billion; $1.34 billion for irrigated crops, $933 million for dryland crops, and $149 million for livestock enterprises; contributing 14 percent of total agricultural production value for the state across all industries (Figure 24).
This represents a $1.24 billion increase in gross production value for the region over the past 10 years. In 2009–10 irrigated crops had a gross value of $586 million, dryland crops $544 million, and livestock industries $60 million; contributing 11.5 percent of the states total agricultural production value (44).
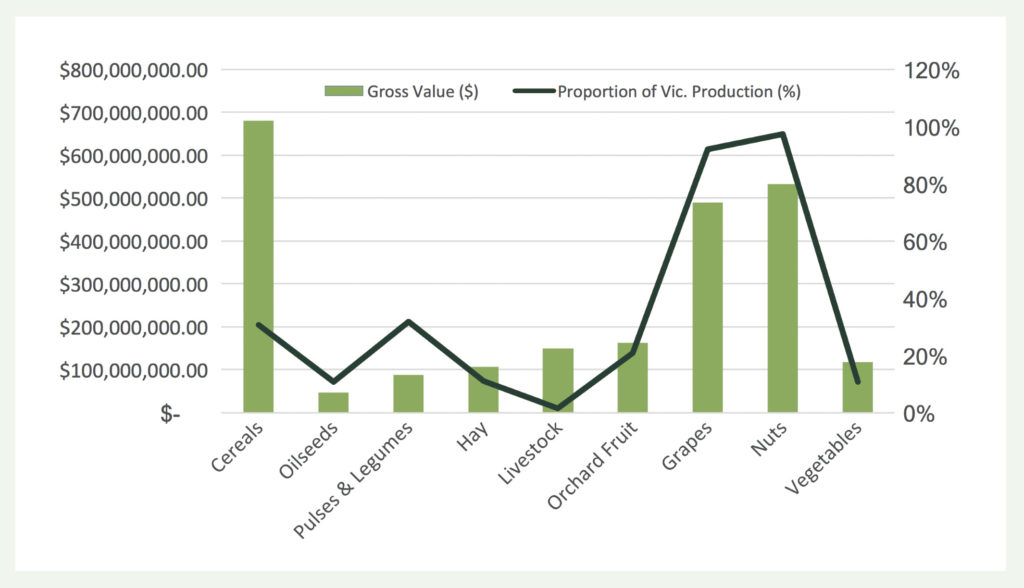
Figure 24 | Gross value and proportion of Victorian agricultural commodities produced in the Mallee (Source: ABS – Value of Agricultural Commodities Produced, 2019-20).
Area
While the area of dryland agriculture in the Mallee has remained relatively stable over the past 30 years, with satellite imagery analysis identifying a 2 percent (48,000 ha) increase between 1987 and 2019 (45); irrigated areas have increased significantly. Between 1997 and 2021 (for which comprehensive irrigation crop data is available) irrigation development reliant on water from the Murray River has increased from 39,470 hectares to 81,355 hectares, representing a more than doubling of the irrigable area. There is a further 6,785 hectares of irrigable land in the Murrayville groundwater irrigation area, a 5,580 hectare increase since 1997 (Figure 25).
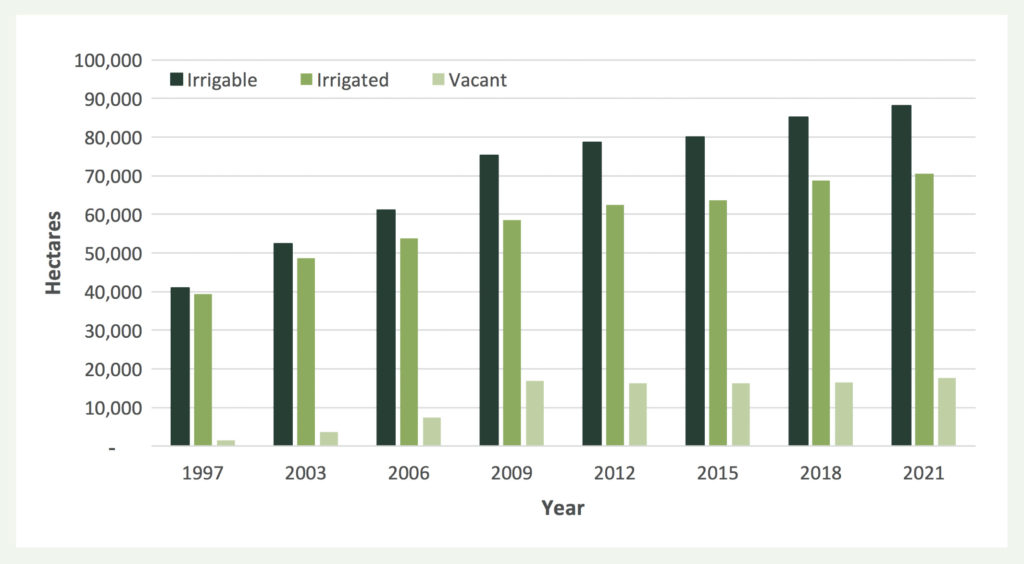
Figure 25 | Area of irrigable land irrigated (source: MCMA, unpublished data 2022).
Crops
Historically, the Mallee dryland farming system was based on a mixed farming enterprise with cropping paddocks sown to cereals in rotation with pasture/stubble paddocks for grazing livestock, and often in heavier soil types, a third year of long-term fallow to achieve weed and disease control and water storage benefits. Intensification of this system over the past 30 years has seen increased areas being sown to cereals (primarily wheat and barley) and the use of break crops (e.g. legumes) in place of traditional pasture options (Figure 26).
Almonds, 99 percent of which are grown by private diverters, have become the region’s single largest irrigated crop by area and water demand. Within the irrigation districts there has also been a resurgence of table grapes in recent years (Figure 27).
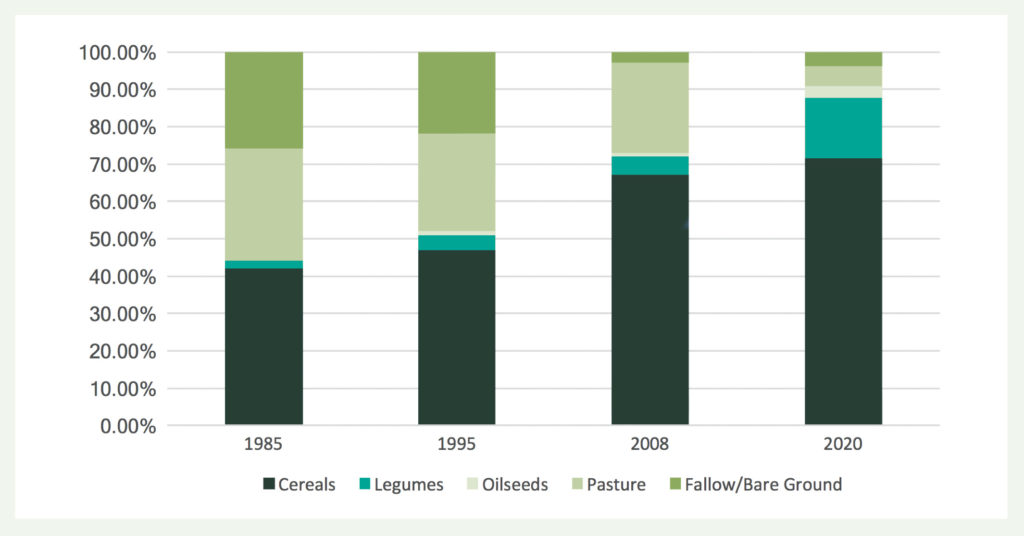
Figure 26 | Major dryland crops in the Mallee by area (source: Adapted from Mallee Land Management & Soil Erosion Spring Surveys)
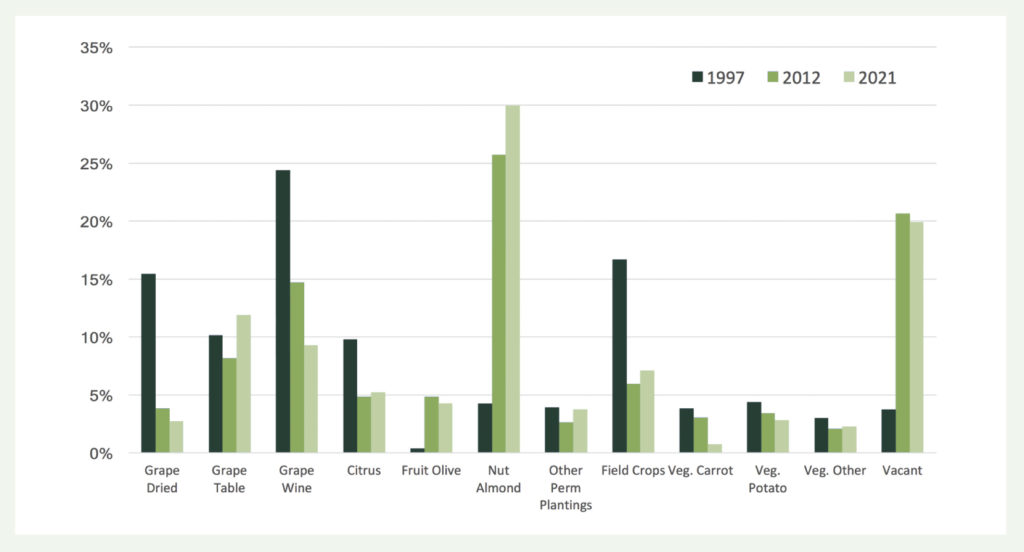
Figure 27 | Major irrigated crops in the Mallee by area (source: MCMA, unpublished data 2022).
Management
Long term changes in dryland and irrigated agriculture management practices, and associated impacts on the soil and water resources they rely on, have also been applied as condition indicators.
Soils
Widespread changes in dryland agriculture over the past 30 years have supported increased vegetation cover, soil aggregation and overall soil stability; reducing the risk, incidence and severity of soil erosion events.
The use of conventional fallow, for instance, has been reduced considerably, from between 30 to 50 percent of monitored sites in the 1990’s to an average of less than five percent over the past five years. Conversely, the increased use of legumes as break crops can produce more fragile stubbles, which are prone to faster decomposition than cereals and may increase erosion risk.
The total vegetation cover (TVC) threshold for effective protection of soils from wind erosion is 50 percent (46). Groundcover observations demonstrate that on average, 80 percent of agricultural land in the region exceeded this target between 2001 and 2021; with the 10th percentile being 45 percent (Figure 28).
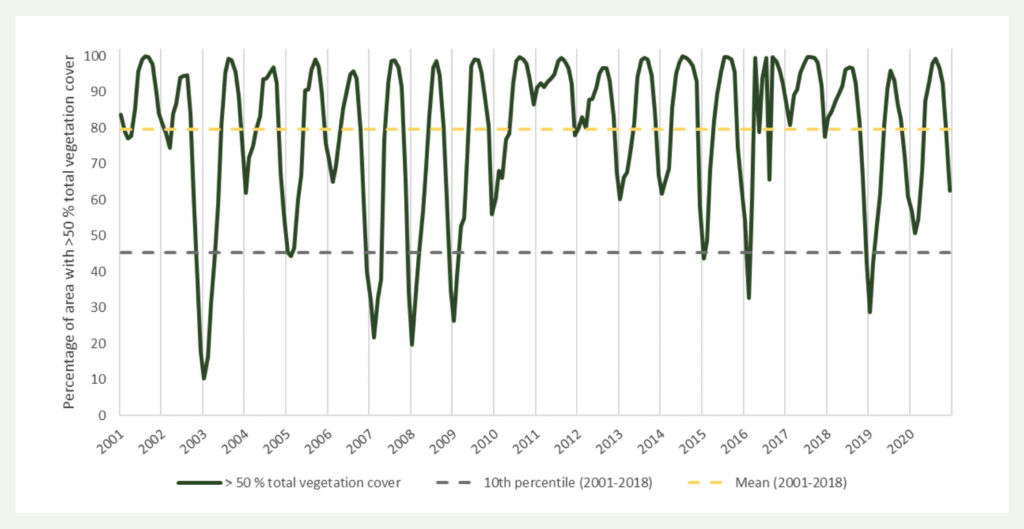
Figure 28 | Percentage of agricultural land protected from wind erosion (>50% TVC) (source: Monitoring wind erosion and land management in the Victorian Mallee – Annual Report 2020, DJPRR 2021).
Significant variability in groundcover continues to be evident across the region however, with rainfall being a key influencing factor. For example, following their lowest annual total rainfall on record in 2019, less than 10 percent of the northern Mallee achieved the 50 percent groundcover target in February 2020. Erosion risk was also relatively high in the central and southern Mallee which recorded decile 1 and 2 conditions respectively for 2019 (Figure 29).
The region also recorded the most dust activity between July 2019 to April 2020 since monitoring commenced in 2005, with four to eight times more events (depending on location) than in the previous worst year of 2009 (47).
Organic Carbon (OC) is typically below one percent in Mallee dryland agricultural soils, but varies considerably (generally between 0.2 and 1.7%) across monitored sites according to their underlying soil (i.e. shifts from loam in the north to clay loam/clay soils in the south). A decline in the median OC levels for all land systems has been observed from 2010–2012 baseline assessments and while it is well documented that there is a temporal downward trend in OC levels in Australian cropping soils, OC can also vary with season. Further monitoring is therefore required to determine if observed changes in OC as a soil health indicator is a long term trend or due to short term (seasonal) variation.
Water
Since water entitlement unbundling in 2007, the amount of water issued for irrigation from the Murray River as an Annual Use Limit (AUL) has increased by 60 percent, from 518 gigalitres AUL in 2007 to 828 gigalitres AULmin 2021 as a result of new irrigation developments and redevelopments. The actual water diverted from the Murray River for irrigation in 2021 however was 514 gigalitres, or 62 percent of AUL (48).
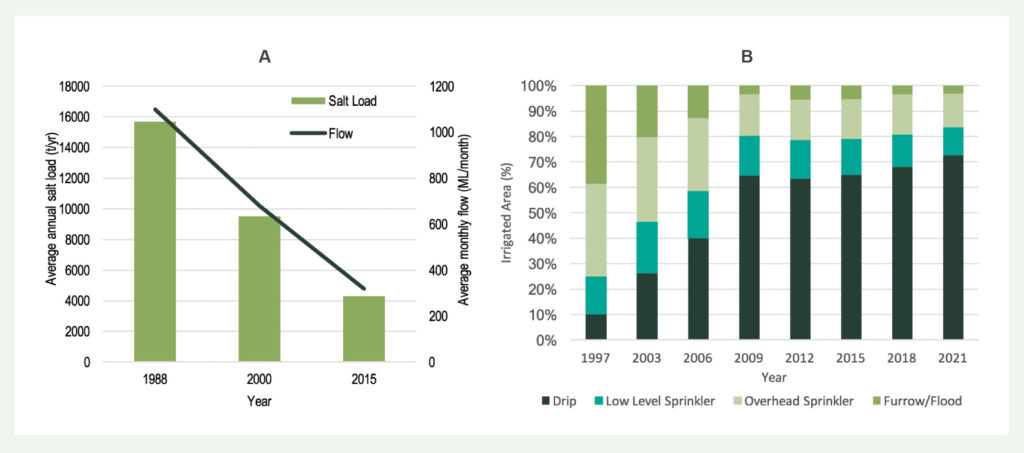
Improvements in irrigation management over the past 30 years, including a significant reduction in the use of both flood and overhead sprinkler applications, have decreased subsurface drainage flows to the river, to the floodplain and to inland drainage basins. This practice change has also decreased the groundwater mound under the older irrigation areas, decreasing saline groundwater flows to the river and floodplain (Figure 30).
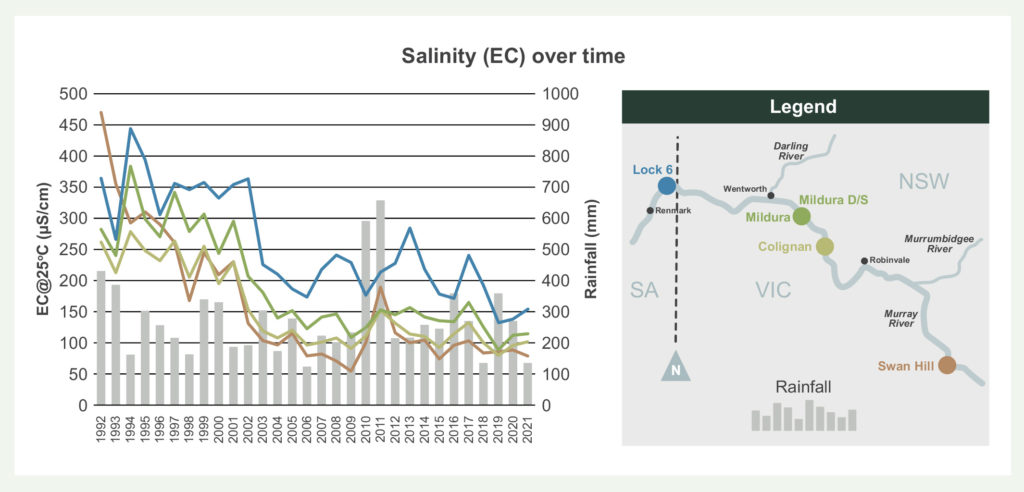
Improved irrigation practices have also supported a trend of decreased river salinity from Swan Hill to Lock 6 (Figure 31). A large decrease in salinity is evident in the early 2000s when, during the Millennium Drought, there was reduced irrigation supply and substantial investment in irrigation efficiencies. While spikes in salinity still occur, generally following major floods (i.e. 1993, 1999, 2011 and 2016), the overall trend of reduced salinity has continued.
Annual calculations of salinity credit consumption through irrigation development is a key regional reporting requirement under both Basin Salinity Management (BSM) 2030 and the Catchment and Land Protection Act 1994. The BSM2030 salinity accountability framework commits partner governments (including Victoria) to maintain agreed salinity levels and ensure their actions which increase river salinity are offset by investing in actions to reduce salinity.
This framework is implemented through the BSM2030 salinity registers, under which the Mallee currently holds a total salinity credit allocation of 23.22 EC. In June 2021, the progressive total of salinity debits in the Mallee was calculated to be 13.8 EC, representing a 9.42 EC credit and ongoing compliance at a regional scale (49).
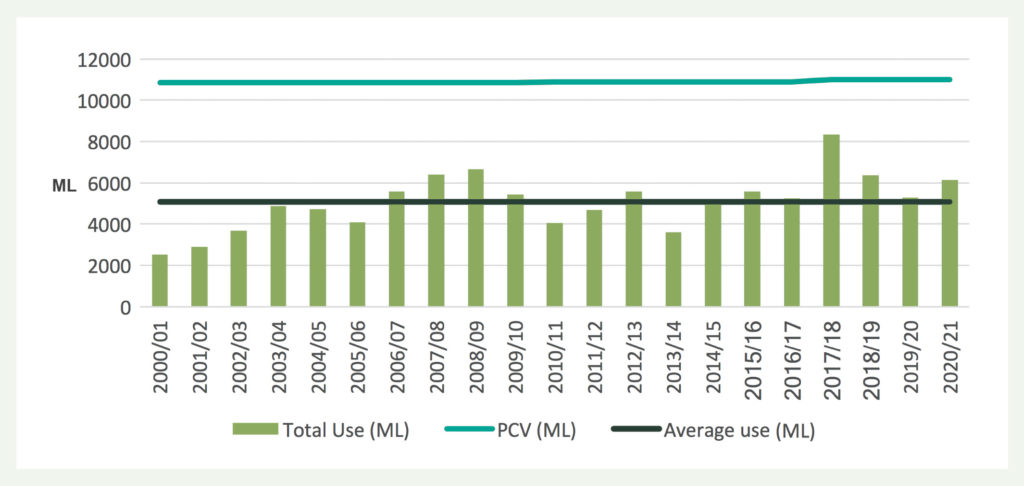
Within the Murrayville Groundwater Management Area (GMA), current levels of use continue to be within the permissible consumptive volume (PCV) of 11,005 ML/year, as defined by the Minister for Water in July 2017. In 2020–21 the total licence entitlement was 9,755 ML, with 63 percent (6,151 ML) of this volume extracted (Figure 32).
The Murrayville GMA Local Management Plan (2017) also establishes a drawdown resource condition threshold of 0.65m per year to ensure this non-renewable groundwater resource is managed as far as practicable for long-term sustainability, with the trigger for management intervention (e.g. restrictions) being two successive years of drawdown greater than the threshold based on a five year rolling average. Monitoring of water levels within five assessment areas indicates that while there are clear seasonal fluctuations in response to pumping, due to the confined nature of the aquifer, water levels continue to demonstrate a recovering trend and the drawdown threshold has not been exceeded during the 2017–21 period. Salinity levels also remain stable across the Murrayville GMA (50).
(44) Australian Bureau of Statistics: Value of Agricultural Commodities Produced 2009-10.
(45) Victorian Landcover Cover Time Series, DELWP 2020.
(46) Leys, J.F. (1999). Wind erosion on agricultural land. In A.S. Goudie, I. Livingston, & S. Stokes (Eds.), Aeolian Environments, Sediments and Landforms (pp. 143-166). England: John Wiley and Sons
(47) DustWatch Monthly Reports: NSW Office of Environment and Heritage, July 2019 to June 2020.
(48) MCMA: Unpublished data. 2021.
(49) BSM2030 Annual Implementation Report 2020-21, MCMA 2021.
(50) GWM Water (2021). Annual Report 2020-21: Murrayville Local Management Plan (Groundwater).
This section outlines the major threats and drivers of change influencing the condition and management agricultural land in the Mallee; core management and strategic directions that will guide delivery of our actions over the next 6-years; and the associated regulatory, policy and planning framework that informed their development.
Major threats and key drivers of change
It is evident that despite the positive changes in land management being applied in the Mallee, the productivity of our dryland and irrigated agricultural lands continue to be vulnerable to a range of processes such as such as wind erosion, salinity, pests and diseases, which if not managed appropriately have the potential to degrade the soils and water resources they rely on; and to potentially reduce the area available for production into the future.
Land management practices not only have the potential to impact on the productivity of agricultural land, but also on adjacent natural and cultural values. Off-site impacts such as sand drift, salinity, waterlogging, nutrient enrichment, and spray drift can have significant impacts on the health of our native species, waterways and culturally significant sites.
External factors such as climatic conditions (both variability and change), water availability and deliverability, and global markets are also key determinants of both overall productivity and the incidence of off-site impacts that require ongoing attention and adaptive management by our agricultural industries.
Opportunities such as emerging carbon markets, application of new technology, and increased Traditional Owner participation in land and water management may also provide for ongoing improvements in the health of our agricultural landscapes.
Further detail on the challenges, opportunities and major threats influencing dryland and irrigated agricultural production, and the soil and water resources they rely and impact on is provided in Section 1 (The Region – 4: Key Drivers of Change).
Aligned plans
Identification of the priority management and strategic directions detailed below has been informed by federal and state legislation, policies and strategies, regional strategies and action plans, and stakeholder priorities. The primary federal, state and regional instruments considered through this process are detailed in Appendix 2.
The Mallee currently has two overarching plans that collate stakeholder strategic directions, priorities and targets for agricultural land: The Victorian Mallee Irrigation Region Land and Water Management Plan (2020–29); and the Mallee Dryland Sustainable Agriculture Strategy (2017–23).
Planning frameworks that focus on specific locations and/or issues (e.g. Murrayville GMA Local Management Plan) are identified within the associated ‘Local Area’ (see Section 4).
Management directions
The current condition of Mallee dryland and irrigated agricultural production, and the soil and water resources they rely and impact on; the key drivers influencing this condition; associated planning instruments; and stakeholder priorities have directly informed the development of five key principles to direct our efforts. Specifically, that programs focus on actions which will support dryland farmers and irrigators to:
- Protect and restore agricultural soils for improved productivity, sustainability and resilience
- Improve water-use efficiency, maximising productivity from available water
- Control, and recover from pest, disease and weed impacts
- Reduce the off-site impacts of land and water management practices
- Adapt and respond to change.
In developing programs to deliver against these principles, the following priorities have been identified to inform how our actions are planned and implemented:
- Research, extension and industry partnerships to support effective knowledge transfer
- Supporting innovative approaches to delivery, including the application of new technology
- Diverse, adaptable, and resilient agricultural systems that maximise production potential, minimise risk, and enhance viability – including drought preparedness and climate ready strategies
- Maintaining groundcover above regional thresholds
- Increasing the soil organic carbon stocks of agricultural soils – including collaborations to maximise the potential of emerging carbon markets
- Managing rootzone drainage within required thresholds
- Management options for reclaiming, stabilising and utilising agricultural soils that are severely degraded, and have limited production potential
- Anticipatory and adaptive approaches to pests, disease and weed management – incorporating sound biosecurity practices and cross-tenure collaboration
- Incorporation of cultural values, objectives, knowledge and practice; as self-determined by Traditional Owners.
Priority directions for building stakeholder, Traditional Owner and the broader community’s participation in and capacity for natural resource management, including agricultural land, are outlined in Section 3.5 (Community Capacity for NRM).
Priority directions for the protection of Traditional Owner/ First Peoples cultural values are outlined in Section 3.4 (Culture and Heritage).
Agricultural land in the Mallee is expansive and diverse. Complex interactions with the soil and water resources that support production, the potential for off-site impacts on adjacent natural and cultural values, and the challenges posed by a changing climate all require ongoing consideration and effective management strategies to optimise productivity while minimising impacts.
Given the finite resources available to implement agricultural land related programs, it is not feasible to expect that all asset x threat interactions can be addressed over the life of this RCS. To help ensure we achieve the ‘best’ results with the resources available, a targeted delivery framework is applied.
Priority locations for addressing specific threat processes will be determined according to:
- The likelihood and impact (both current and potential) of the threatening process (i.e. risk)
- The capacity of the available management actions to address the threatening process (i.e. effectiveness)
- The level of resources required to exercise that capacity (i.e. cost: benefit).
It is noted that under most prioritisation frameworks, the value of the asset (i.e. economic, environmental, social, cultural) would also represents a key consideration. For agricultural land there are however no analyses currently available to differentiate relative value. As such, it is considered a dispersed asset of equal value for the purpose of this RCS.
Processes undertaken to prioritise and target management actions will therefore rely on spatial assessments of threat likelihood and impact x intervention effectiveness. To provide for continuous improvement and support adaptive management processes; ongoing application of local expertise, Traditional Owner knowledge and best available science is also fundamental to the RCS Agricultural Land targeted delivery framework.
This section outlines the medium-term (6-year) and long-term (20-year) outcome targets that regional stakeholders have collectively set for agricultural land management across the Mallee.
Our medium-term outcome targets (Table 9) for agricultural land have been developed to align with and demonstrate how the Mallee RCS will contribute to state-wide and regional indicators.
Delivery against these targets will be undertaken as part of the RCS’s integrated catchment management (ICM) – landscape scale approach to NRM. Detail on the specific management actions and targets to be implemented within individual landscapes, and the local stakeholders that will contribute to their delivery is provided in Section 4 (i.e. Local Areas).